Python培训实例:2017年7月与2019年7月国际外汇市场美元/人民币汇率走势
更新时间:2022年03月29日10时45分 来源:传智教育 浏览次数:
汇率又称外汇利率,指两种货币之间兑换的比率,亦可视为一个国家货币对另一种货币的价值。汇率会受诸多外界因素的影响而出现上下波动,从而产生货币贬值和货币升值的现象。已知2017年7月与2019年7月国际外汇市场美元/人民币的汇率如表4-4所示。
表4-4 2017年7月与2019年7月美元/人民币的汇率
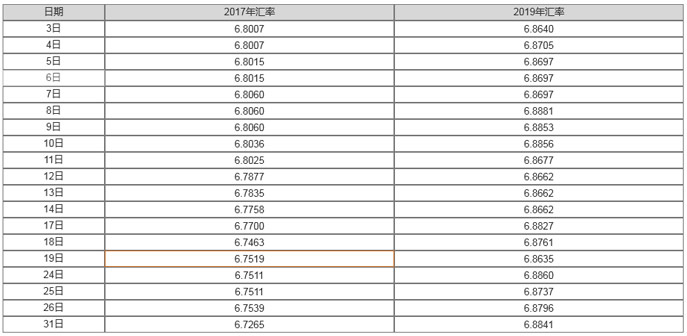
根据表4-4的数据,将“日期”一列的数据作为x轴的刻度范围,将“2017年汇率”和“2019年汇率”两列数据作为y轴的数据,使用plot()函数分别绘制反映2017年7月与2019年7月美元/人民币汇率走势的折线图,并使用实线和长虚线进行区分,具体代码如下。
# 02_dollar_RMB_exchange_rate
import numpy as np
import matplotlib.pyplot as plt
plt.rcParams["font.sans-serif"] = ["SimHei"]
plt.rcParams["axes.unicode_minus"] = False
# 汇率
eurcny_2017 = np.array([6.8007, 6.8007, 6.8015, 6.8015, 6.8060,
                        6.8060, 6.8060, 6.8036, 6.8025, 6.7877,
                        6.7835, 6.7758, 6.7700, 6.7463, 6.7519,
                        6.7511, 6.7511, 6.7539, 6.7265])
eurcny_2019 = np.array([6.8640, 6.8705, 6.8697, 6.8697, 6.8697,
                        6.8881, 6.8853, 6.8856, 6.8677, 6.8662,
                        6.8662, 6.8662, 6.8827, 6.8761, 6.8635,
                        6.8860, 6.8737, 6.8796, 6.8841])
date_x = np.array([3, 4, 5, 6, 7, 8, 9, 10, 11, 12,
                   13, 14, 17, 18, 19, 24, 25, 26, 31])
figure = plt.figure()
ax = figure.add_subplot(111)
# 第1条折线:湖绿色, 实线, 线宽为 2
ax.plot(date_x, eurcny_2017, color='#006374', linewidth=2,
        label='2017年7月美元/人民币汇率')
# 第2条折线:紫色, 长虚线, 线宽为2
ax.plot(date_x, eurcny_2019, color='#8a2e76', linestyle='--',
        linewidth=2, label='2019年7月美元/人民币汇率')
ax.set_title('2017年7月与2019年7月美元/人民币汇率走势')
ax.set_xlabel('日期')
ax.set_ylabel('汇率')
ax.legend()
plt.show()
运行程序,效果如图4-3所示。
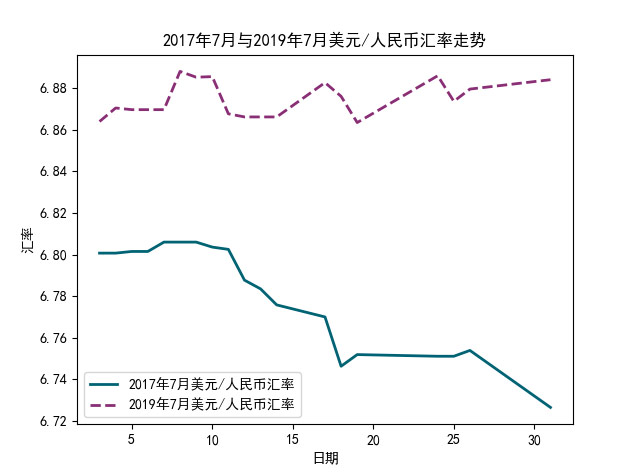
图4-3 2017年7月与2019年7月国际外汇市场美元/人民币汇率的折线图
图4-3中,紫色的虚线代表2019年7月的汇率,湖绿色的实线代表2017年7月的汇率。由图4-3可知,2019年7月的汇率呈现较为平稳的趋势,2017年7月的汇率呈现下降趋势。


 AI智能应用开发
 AI大模型开发(Python)
 AI鸿蒙开发
 AI嵌入式+机器人开发
 AI大数据开发
  AI运维
AI运维 AI测试
AI测试 跨境电商运营
 AI设计
AI设计 AI视频创作与直播运营
 微短剧拍摄剪辑
 C/C++
C/C++ 狂野架构师
狂野架构师


